by Dan Lucas
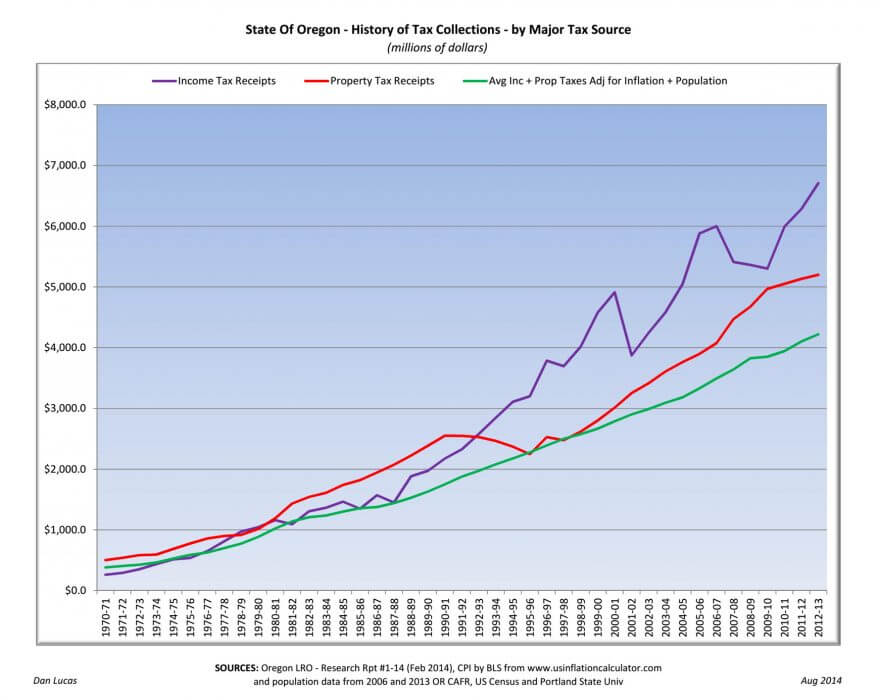
In researching an article on property taxes a few weeks ago I ran across some good historical data on Oregon tax collections in a February 2014 research report from the Oregon Legislative Revenue Office (LRO). I used the data from that report to create the chart in this article.
What’s in the chart?
Purple line: this shows 40+ years of Oregon income taxes. Income taxes paid to the state include “corporate income taxes” (a misleading distinction – it doesn’t include all business income tax or even all the income taxes paid to Oregon by corporations) and personal income taxes that include income taxes paid on wages, dividends & interest, business income, net capital gains and retirement income. Income taxes are the primary revenue source for the state’s General Fund.
Red line: this shows 40+ years of statewide property taxes. As noted in the recent article on property taxes, “county and city governments get most of their tax base from property taxes, and school districts and community colleges get large portions of their funding from property taxes.”
Green line: this line shows an average of the starting (1970-71) income taxes and statewide property taxes and then increases that amount each year for the inflation (CPI) for that year as well as for the Oregon population increase for that year. This line represents a baseline for what Oregon income and property taxes would be if they only increased for inflation and population growth.
What’s NOT in the chart?
The chart doesn’t include revenue from the lottery or all of the taxes and fees that are paid into the state’s Other Fund – which includes tobacco taxes, healthcare provider taxes, inheritance taxes, insurance premium taxes, motor fuel taxes, weight mile taxes, vehicle registration taxes, etc.
General observations
- The excessive increases in statewide property taxes are evident in the decade leading up to Measures 5 and 50 in the 1990s. The impact of those measures can be seen as property tax increases are held in check to a much greater degree in the 1990s.
- During the 40+ years, statewide property taxes have outstripped inflation and population growth by about $1 billion – ending up at $5.2 billion rather than $4.2 billion.
- During the 40+ years, income taxes have outstripped inflation and population growth by about $2.5 billion – ending up at $6.7 billion rather than $4.2 billion.
Click here for a PDF of the chart
To read more from Dan, visit www.dan-lucas.com

