Special Report By Bob Clark, Economist
& The Taxpayer Association of Oregon,
Oregon Senate Joint Resolution 2 Would Undo Measure 50 Property Tax Limits
Oregon Senate Resolution 2 (SJR2) proposes to raise property assessed values (AV), and by doing so, substantially increase property tax bills in general. SJR2 would place a floor rate on assessed value equal to 0.75 of property market value (what is also known as real market value, or RMV). This minimum ratio – Tax Assessed Value (AV) to Real Market Value (RMV) – would apply to all classes of real property including homes and business buildings, with only a few exceptions such as for certain Farm and forestry properties (1).
As of July 2017, Oregon’s home property sector had an average ratio of 0.66 tax assessed value (AV) to Real Market Value (RMV). Judging by reported home price increases between July 2017 and July 2018, Oregon’s homes generally have an average ratio of 0.64 currently (2).
The net effect of SJR2 if enacted, then, is a 17% increase in residential property tax bills in the near term (phased in over 5 years), statewide and assuming no other changes (derived by subtracting 0.75 from 0.64 and dividing this result by 0.64).
But also, most importantly, SJR2 if enacted, increases property taxes with increases in home market values (although housing downturns interrupt the general rise in home prices, occasionally); rather than Measure 50’s 3% cap on annual increases.
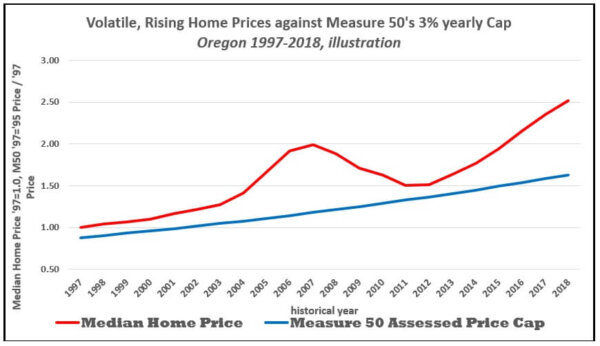
Instead of 3 percent increases in annual property taxes, SJR2 more likely results in 4.5 to 5.0% annual increases in property taxes on average; assuming continuing trend in home price increases since passage of Measure 50 in 1997, constant property tax rates for education and general government, and excluding bond measures for government buildings such as schools. The chart above illustrates the effectiveness in Measure 50 in limiting assessments against escalation in Oregon home prices.
SJR2 is not tax revenue neutral, but rather would raise property tax revenues in short order by perhaps as much as one billion dollars state wide, from all taxable properties (3).
Property Taxation and Equity
I testified before Senator Hass’ Committee on property taxes in the 2017 Oregon legislative session. The contention for undoing Measure 50 then, and even now, is that Measure 50 causes inequitable treatment of like homes, with some homes having a relatively low assessed value to real market value and some having relatively high assessed value to real market value; all this resulting in significant differences in property tax treatment.
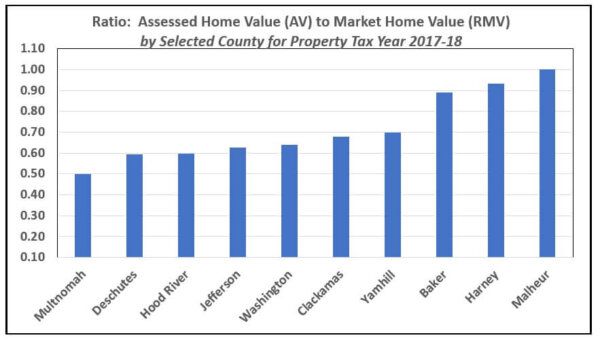
Indeed, the ratio AV to RMV varies rather significantly among Oregon counties. For instance, the average residential ratio for Multnomah County is relatively low at 0.50 whereas Malheur County is much higher at 1.00. SJR2 wouldn’t impact much at all Malheur County home owners (generally speaking); but for Multnomah County home owners, SJR2’s floor rate of 0.75 would generally cause property tax bills to increase 50% in short order (4).

But correcting Measure 50’s perceived inequity ignores that SJR2 creates its own perceived inequities. SJR2’s increase in tax revenues for state and local governments is a transfer of dollars from property owners to perhaps public sector retirees, for instance; seeing how these extra dollars may help to prop up an otherwise unsustainable Public Employee Retirement System (PERS). I say this as my North Clackamas School District last year asked and voters barely approved a special operating levy; the school district having stated most clearly in its budget document it is facing escalating PERS charges and is in need of additional revenue to offset these PERS charges (5).
Moreover, what of the persons recently buying a home in say Multnomah County with a low ratio of 0.50; having entered a mortgage assisted in some part probably by a low rate of property tax? These persons might be young and just buying their first home and didn’t enjoy the decades of rising home prices which the previous owners of their house probably enjoyed along with Measure 50 limited property tax bills.
Lastly, these County ratios are only averages. There is a large segment of home owners within a county who have much lower ratios. For instance, in Clackamas County the average ratio in the current tax year is 0.65 (implying a 15% increase in property tax on average county wide with SJR2); but at the same time, among Clackamas home owners, 27% have ratios of 0.60 or less (implying an increase of at least 25% in their property taxes with SJR2). Some of these latter home owners are no doubt “home rich” but income not so much. So, SJR2 could cause some financial hardship for these home owners on the margin, as their property tax bills jump by $100 or more per month (6).
Some parting thoughts
Existing home owners and property owners who have owned their property for more than 20 years now, have enjoyed rising home resale values on paper, albeit with some trepidation in the Great Recession of 2007-09.
At the same time: In a recent study, author Randall Pozdena demonstrates both Oregon and the Portland Metro area are very home supply constrained; meaning land-use policies such as the Urban Growth Boundary have accentuated escalation in home values (Randall Pozdena, “The Housing Affordability Crisis: The Role of Anti-Sprawl Policy,” January 2019, Cascade Policy Institute).
Anti-sprawl (so called smart growth) policy creates economic rent for existing home owners especially those in urban areas. But at the same time, economic data show incomes of home owners generally lagging the escalation in their home values, meaning the ability to pay property taxes commensurate with rising home values lags. Enter Measure 50. Measure 50 passes in the year 1997, realigning many home owners’ ability to pay property taxes (7).
Against this, public school districts and cities most often lament the enactment of Measure 50, as robbing them of adequate funding. But things like PERS consume increasing amounts of public-school funding and City funding, muting desires among many voters to increase school funding and other public funding.
Against this backdrop, it seems much simpler if government allowed housing markets to become freer than presently so as to limit house price inflation; and also, if free market choice were injected into the public sector, for instance, having public schools compete against alternative schools. With these deregulatory steps, the need for Measure 50 very probably falls away, and property taxes can be re-aligned with real market value assessments, as house prices and public needs grow in line with incomes through freer competing forces.
But if only this were the case. Instead it seems inevitable we are in a perennial “food fight,” having abandoned the concept of limited government and the full use of free markets -Tom McCall some decades ago now, having introduced planning and land use restrictions into Oregon’s governance (8).
1. Link to SJR2, .
2. Oregon Department of Revenue, Oregon Property Tax Statistics, Fiscal Year 2017-18; Federal Reserve Bank of St. Louis for 2017 to 2018 Oregon Median Home price increase.
3. Total Oregon Property Tax revenues for the year 2017-18 is $6.76 billion and an aggregate ratio AV to RMV of 0.65; meaning a 15% increase in property tax revenues for Oregon governments, or just over $1 billion in additional yearly property taxes statewide; this may overstate the amount of increase because the ratio is an aggregate average. But offsetting such possible over statement, property prices may increase faster than 3% per year over the next three years before possible implementation (if voters approve SJR2 in November 2020), causing the assessment ratio to decrease further.
4. Oregon Department of Revenue, Oregon Property Tax Statistics, Fiscal Year 2017-18.
5. North Clackamas School District, 2017-18 Adopted Budget, page 5.
6. E-mail from Lynn Longfellow, Appraisal Manager, Clackamas County Department of Assessment and Taxation, January 17, 2019.7.
7. St. Louis Federal Reserve data series for Oregon Median Household Income, years 1984 through 2017.
8. Randal O’Toole, pages 146-147, The Vanishing Automobile and other urban myths.